Measurement
How to measure prospecting software performance
A practical guide to prospecting software measurement, covering attribution, benchmarks, dashboards, CRM reconciliation, data protection and reporting habits.
What to take away
- Most teams measure activity, not outcomes. Calls logged and emails sent tell you nothing about whether the pipeline was worth the spend.
- Attribution is a choice, not a fact. Pick one method, document the rules and keep them stable for at least two quarters.
- Benchmarks pulled from a single team are anecdotes. Use a defined sample, a stated period and a published method before you quote a number.
- Dashboards fail when they hold too many metrics. Five to seven measures, each with an owner, is the practical ceiling.
- Any data you hold on prospects creates legal duties, including the possibility of a data protection fee and clear rules on marketing claims.
Why activity metrics flatter prospecting software
Most teams start by counting what the tool makes easy. Emails sent, calls dialled, connections requested, sequences completed. These numbers rise when you add seats, which makes them feel like evidence of progress.
Effort, Response, Outcome
Effort
- What it describes
- What team did
- Example metric
- Emails sent
- Board pack?
- No
Response
- What it describes
- What prospects did
- Example metric
- Reply rate
- Board pack?
- No
Outcome
- What it describes
- What business gained
- Example metric
- Meetings booked
- Board pack?
- Yes
They are not. A sequence that delivers 4,000 sends and no meetings has not performed better than one that delivers 400 sends and six meetings. The first number is larger, but it describes effort rather than result.
The error compounds when activity data sits in the same dashboard as revenue. A rising send volume next to a flat pipeline looks like a conversion problem. Often it is a targeting problem, and the activity metric hides it.
Start by separating measures into three groups. Effort describes what your team did. Response describes what prospects did. Outcome describes what the business gained. Only the third group belongs in a board pack.
Choose an attribution method and stop changing it
Attribution answers a simple question: which touch gets credit for a deal? The honest answer is that several touches usually contributed, and any single-credit model is an approximation.
Attribution Models Compared
First-touch
- Credit goes to
- Record creator
- Favours
- Paid channel
- Risk
- Overstates top
Last-touch
- Credit goes to
- Pre-signature touch
- Favours
- Closing channel
- Risk
- Overstates bottom
Linear
- Credit goes to
- Every interaction
- Favours
- All channels
- Risk
- Arithmetic shift
First-touch credit favours whatever created the record. Last-touch credit favours whatever happened before the signature. Linear models split credit across every recorded interaction. Each produces a different ranking of channels from the same underlying data.
The mistake is switching models when the ranking becomes inconvenient. If the paid channel looks weak under last-touch, a team may move to a linear model and report an improvement that reflects arithmetic rather than performance.
Pick a model, write down the rules, and state the model on every report. If you change it, restate prior periods on the new basis so the trend line stays honest. Our guide to prospecting software attribution methods sets out how the common models behave on the same deal data.
Build benchmarks you can defend
A benchmark is a claim about what normal looks like. To make that claim you need a defined population, a defined period and a defined calculation.
Defensible Benchmark Checklist
- Define the population
- Define the period
- Define the calculation
- Use twelve months of closed deals
- Group by source
- Record definitions for next time
Start with your own historical data. Take twelve months of closed deals, group them by source, and calculate reply rates, meeting rates and win rates on the same basis. Then record the definitions so the next calculation matches.
Where you need an external comparison, be explicit about what it covers. A figure drawn from a handful of accounts is an illustration, not a market rate. Say so in the footnote.
If you are benchmarking a UK sales function, geography matters. Regional pay, sector mix and company size can all affect results. State the population and sample boundaries, and avoid treating a small group of accounts as a market-wide benchmark.
Decide what belongs on the dashboard
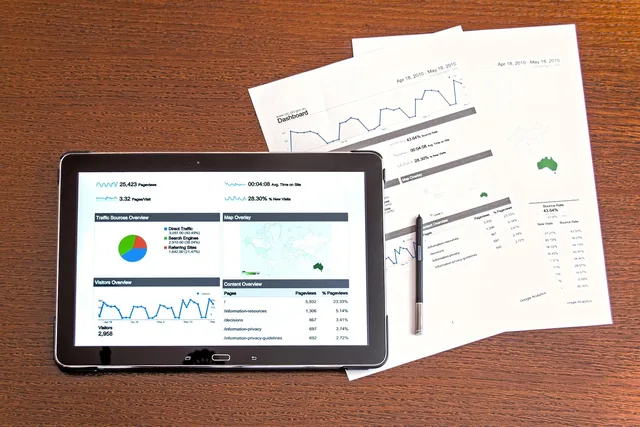
A prospecting dashboard has one job: to tell a reader whether the pipeline is healthy and where to intervene. Every metric that does not serve that job is noise.
Dashboard Metric Set
- New records created
- Contact rate
- Meeting rate
- Qualified opportunity rate
- Cost per qualified opportunity
- Pipeline value by source
- Cycle length
Give each metric an owner and a review rhythm. A number nobody owns will drift, and a number nobody reviews will be distrusted within a quarter.
Keep the layout stable. Reordering tiles every month forces readers to relearn the page, and they stop reading it. Our notes on building a prospecting software reporting dashboard cover layout, refresh timing and how to label a metric so two people calculate it the same way.
Reconcile the tool against the CRM
Prospecting platforms such as Apollo and Outreach keep their own records of what happened. Your CRM, such as Salesforce or HubSpot, keeps another.
Monthly Reconciliation Steps
- Run on a fixed date
- Compare record counts
- Compare meeting counts
- Compare opportunity counts
- Log the difference
- Write result into report
The usual causes are timing, deduplication and ownership rules. A sequence step logged at 23:50 may land in the CRM on the following day. Two records for the same person may be merged in one system and not the other. A rep who leaves may take their activity history with them.
Run a monthly reconciliation on a fixed date. Compare record counts, meeting counts and opportunity counts between the two systems, and log the difference. A stable gap of two or three per cent is normal. A gap that widens month on month points to a process problem, not a reporting one.
Write the reconciliation result into the report. Readers trust a number more when they can see how it was checked.
Set the legal and security boundaries
Prospecting data is personal data, and holding it brings duties under the UK General Data Protection Regulation (UK GDPR) and the Data Protection Act 2018. The Information Commissioner's Office explains data protection responsibilities for UK controllers.
Legal and Security Checks
- Check ICO data protection fee position
- Evidence marketing claims
- Review ASA rulings precedent
- Assess supplier against NCSC cloud principles
- Record assessment with contract
Record why the data is held, how it will be used and who can access it. Review those controls when the purpose, audience or supplier changes.
Marketing claims are regulated too. If your outreach or advertising states a result, you need evidence for it. The CAP Code and the Advertising Standards Authority's rulings database for marketing claims provide precedents on targeting and claims.
Hosted prospecting platforms hold prospect records on someone else's infrastructure. Before you sign, assess the supplier against the National Cyber Security Centre's Cloud Security Principles for assessing hosted platforms, and record the assessment alongside the contract.
Report the numbers people act on
A report is not a data dump. It is an argument about where to spend next quarter.
Report Structure
- Lead with the outcome
- Show the driver
- State period and comparison
- State the definition
- One sentence on what changed
- One sentence on why
- One sentence on what next
Lead with the outcome, then the driver. If qualified opportunities fell, state the fall, then show whether contact rate, meeting rate or win rate moved. Readers can act on a driver. They cannot act on a total.
Show the period and the comparison. A number without a prior period is unreadable. A number without a stated definition is arguable.
Keep the commentary short and specific. One sentence on what changed, one on why you believe it changed, one on what happens next. If you cannot fill the third sentence, the report is not finished.
Where a channel is measured through web and app activity, use the platform's own value reporting rather than a proxy. Google's guidance on measuring value from web and app channels in acquisition explains how conversion value is captured and reported, which is the right basis for a channel-level claim.
Match the metric to the buying motion
Different motions need different measures. A high-volume, low-value motion lives on contact and meeting rates. A small, high-value motion lives on account coverage and cycle length.
Transaction-led teams should watch reply quality, not reply volume. Enterprise teams should watch how many of the target accounts were touched at all, and how many buying contacts were reached inside each one.
Product-led teams have a third pattern. The signal is usage rather than conversation, so the metric set shifts towards activated accounts and expansion paths.
Choosing the wrong set is common. A team selling £40,000 contracts that reports daily send volumes may leave the board unable to see progress. Match reported measures to contract value and buying motion, not to what the software makes easiest to count.
Handle small numbers honestly
Small samples mislead. If a rep books three meetings from 60 contacts, that is a 5 per cent rate with a wide margin of error. Reporting it to one decimal place implies a precision the data does not support.
Round small numbers. Group weeks into months when volumes are low. State the sample size next to the rate.
Avoid ranking reps on rates drawn from tiny samples. The difference between the top and bottom performer may be a handful of conversations, and acting on it damages trust in the whole measurement system.
Where small samples make a rate unstable, report the denominator alongside it and avoid presenting a small subgroup as representative. If you compare regions or sectors, define the population first and explain any limits in the report.
Review the measurement stack quarterly
Tools change, data changes and the questions the business asks change. A measurement setup that suited a 20-person team will not suit a 60-person one.
Each quarter, check four things. Are the definitions still accurate? Is the reconciliation gap stable? Does the dashboard still answer the current questions? Is anyone still reading it?
If the answer to the last question is no, the problem is usually scope rather than format. Cut a metric and see whether attention returns.
Measurement work also has an operational side: seat allocation, data hygiene, sequence governance and handover rules. Those sit alongside reporting rather than inside it, but they affect whether the numbers remain complete and comparable.
A short glossary
- Attribution model
- the rule that decides which touchpoint receives credit for a deal.
- Contact rate
- the share of targeted prospects who respond in any way.
- Meeting rate
- the share of targeted prospects who accept a sales conversation.
- Qualified opportunity rate
- the share of meetings that become opportunities meeting your agreed criteria.
- Cost per qualified opportunity
- total prospecting spend divided by qualified opportunities created in the period.
- Reconciliation gap
- the difference between activity recorded in the prospecting tool and activity recorded in the CRM.
- Data controller
- the organisation that decides why and how personal data is processed.
Common questions
How many metrics should a prospecting dashboard hold?
Five to seven is the practical ceiling for a working dashboard. More than that and readers stop scanning. Keep the outcome measures and drop the effort measures unless they explain a movement you are already reporting.
Should we use first-touch or last-touch attribution?
Either can work if you apply it consistently and state it on the report. First-touch suits teams testing new channels. Last-touch suits teams optimising the final conversion step. Changing model mid-year without restating prior periods destroys the trend line.
How often should we reconcile the prospecting tool with the CRM?
Monthly, on a fixed date, is the usual rhythm. Record the gap each time. A stable small gap is fine. A widening gap means a process or ownership problem that reporting cannot fix.
Do we need to pay the ICO data protection fee if we hold prospect records?
Most controllers processing personal data do, subject to limited exemptions, and the tier depends on organisation size and turnover. The ICO publishes the current rules and fee tiers, so check the position for your own organisation rather than assuming an exemption applies.
In this guide
- Six key metrics for lead generation softwareSix lead generation software metrics, with clear definitions, formulas and reporting rules for outbound activity, conversion and qualified pipeline.
- Build a prospecting software reporting dashboard your board will trustA step-by-step guide to building a prospecting software reporting dashboard: pick metrics, label sources, set a refresh cadence and keep the board pack defensible.
- How first-touch, last-touch, linear and position-based attribution differ for prospectingExplains first-touch, last-touch, linear and position-based attribution for prospecting, with a decision table, a worked credit example and sales cycle guidance.
- Spotting prospecting software measurement mistakes without a dashboard rebuildSeven measurement mistakes UK revenue teams make with prospecting software, from drifting pipeline stages to unrated leads, plus a worked example in pounds.
- Why prospecting software benchmark research needs external evidenceExternal sources and fixed definitions make prospecting software benchmark research credible. Here is the evidence to gather before you compare results.